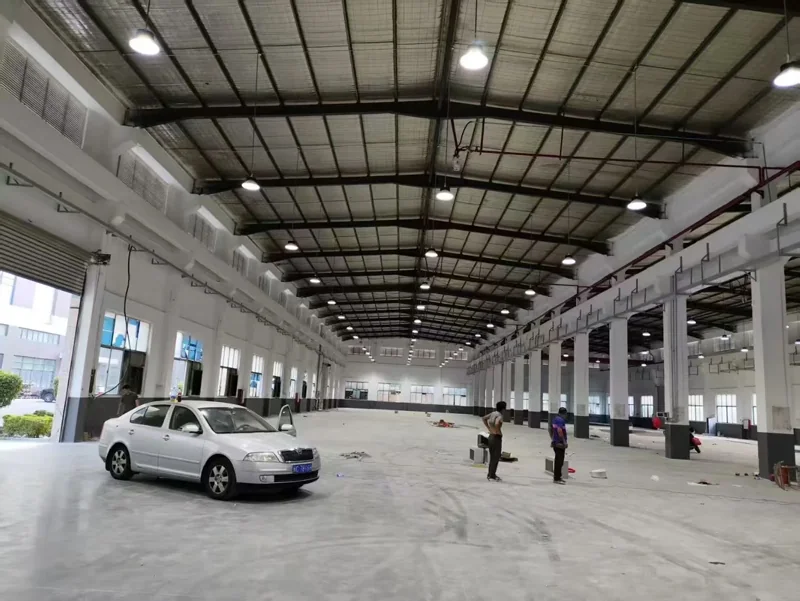
For a 200 lux maintained target, start with 100–150 W LED high bays at 13–20 ft (4–6 m) mounting height, 120–200 W at 20–26 ft (6–8 m), 200–300 W at 26–39 ft (8–12 m), 300–500 W at 39–52 ft (12–16 m), and 400 W upward above 52 ft (16 m). That chart is a first filter, not an answer: it assumes a lux target, a spacing, a beam angle and a room, and your building may differ on all four.
This article publishes the chart with every assumption stated, derives each row so you can see where the numbers come from, and then shows how to check the chart against a real floor plan at 20 ft, 30 ft and 40 ft. The same table now appears on our product pages and in the high bay spacing guide; this page is where its arithmetic lives.
Key Takeaways
- The chart rests on five inputs: 200 lx maintained, utilisation factor 0.8, maintenance factor 0.8, 150 lm/W, and the middle of the spacing-to-height ratio for the stated beam. Change any one and the wattage moves.
- Wattage scales with the square of spacing. At 10 m (33 ft), moving from S/MH 0.8 to 1.2 takes the calculated fixture from about 133 W to 300 W for the same 200 lx.
- The worked checks land inside the chart but not in the middle of it: 100–150 W at 20 ft, 200 W at 30 ft, 300 W at 40 ft, each set by how the grid fits the building.
- A tighter grid of lower-wattage fixtures is an equally valid answer. In the 20 ft example, 30 × 100 W and 20 × 150 W deliver the same 229 lx for the same 3,000 W.
- Racking, dark surfaces, dust and cold rooms each break a different assumption. Specify measured lumens and lm/W, not watts, and confirm with the fixture’s IES file.
The Chart: High Bay Wattage by Ceiling Height
| Mounting height | Wattage (starting point) | Beam | Typical output at 150 lm/W |
|---|---|---|---|
| 4–6 m (13–20 ft) | 100–150 W | Wide 90°–120° | 15,000–22,500 lm |
| 6–8 m (20–26 ft) | 120–200 W | Medium-wide 90° | 18,000–30,000 lm |
| 8–12 m (26–39 ft) | 200–300 W | Medium 60°–90° | 30,000–45,000 lm |
| 12–16 m (39–52 ft) | 300–500 W | Narrow-medium 60° | 45,000–75,000 lm |
| 16 m + (52 ft +) | 400–1,200 W | Narrow / high-mast optics | 60,000 lm + |
Assumptions behind every row:
- Target: 200 lx maintained on the floor (about 18.6 foot-candles), a common general warehousing figure.
- Utilisation factor (UF) 0.8: an open hall with reasonably light surfaces and no racking.
- Maintenance factor (MF) 0.8: the usual planning allowance for lumen depreciation and dirt on a clean, dry site.
- Efficacy 150 lm/W: inside our catalogue range of 120–160 lm/W for the SJGK high bay series.
- Spacing: fixtures on a square grid at the middle of the spacing-to-mounting-height (S/MH) band for the listed beam: 0.8–1.0 for 60°, 1.0–1.2 for 90°, 1.2–1.5 for 120°.
For a 150 lx target, multiply the wattage by 0.75. For 300 lx, multiply by 1.5.
A note on “ceiling height”. The chart uses mounting height, the height of the fixture above the floor. A UFO on a hook or chain hangs below the deck, so a 26 ft ceiling with a 2 ft drop is a 24 ft mounting height. Where the task is on benches rather than the floor, the strict lumen-method height is to the working plane, which trims another metre or so.
How each row is derived
Every row runs the same four lines:
- Spacing = S/MH × mounting height
- Area per fixture = spacing² (square grid)
- Lumens per fixture = 200 lx × area ÷ (0.8 × 0.8)
- Watts = lumens ÷ 150 lm/W
The result is then rounded to a real catalogue step. Our high bay range steps through 100, 120, 150, 200, 250, 300, 400, 500, 600 and 1,200 W.
| Row | Height used | S/MH used | Spacing | Area per fixture | Lumens needed | Calculated watts | Nearest step (lux at that step) |
|---|---|---|---|---|---|---|---|
| 4–6 m | 5 m (16.4 ft) | 1.35 (120° mid) | 6.75 m (22.1 ft) | 45.6 m² (490 ft²) | 14,238 lm | 94.9 W | 100 W (211 lx) |
| 6–8 m | 7 m (23.0 ft) | 1.1 (90° mid) | 7.7 m (25.3 ft) | 59.3 m² (638 ft²) | 18,528 lm | 123.5 W | 120 W (194 lx) |
| 8–12 m | 10 m (32.8 ft) | 1.0 (60°–90° mid) | 10.0 m (32.8 ft) | 100 m² (1,076 ft²) | 31,250 lm | 208.3 W | 200 W (192 lx) |
| 12–16 m | 14 m (45.9 ft) | 0.9 (60° mid) | 12.6 m (41.3 ft) | 158.8 m² (1,709 ft²) | 49,613 lm | 330.7 W | 300 W (181 lx) |
| 16 m + | 18 m (59.1 ft) | 0.8 (narrow) | 14.4 m (47.2 ft) | 207.4 m² (2,232 ft²) | 64,800 lm | 432.0 W | 400 W (185 lx) |
That gives the lower end of each range. The upper end comes from running the same inputs at the top of the height band and rounding up to the next step:
- 6 m at S/MH 1.35 → 136.7 W → 150 W
- 8 m at S/MH 1.1 → 161.3 W → 200 W
- 12 m at S/MH 1.0 → 300.0 W → 300 W
- 16 m at S/MH 0.9 → 432.0 W → 500 W
The 6–8 m row also covers a 120° optic at mid height: 7 m at S/MH 1.35 calculates to 186 W, which lands on the same 200 W step. The last row is open-ended because halls above about 20 m (66 ft) are usually arenas, hangars or process buildings with their own targets, which is where the 600 W and 1,200 W bodies come in and a layout study replaces the chart.
Notice the right-hand column. Rounding to the nearest step leaves several rows a few percent under 200 lx. That is acceptable for a first filter and unacceptable for a signed-off design, which is the argument for the checks below.
Why One Chart Cannot Be Exact
Three inputs dominate, and the chart fixes all of them.
Target lux. Wattage is directly proportional to the target. A bulk store at 150 lx needs three quarters of the chart value; a picking zone at 300 lx needs half as much again. The zone targets themselves are covered in warehouse lumens per square metre.
Spacing and beam. Area per fixture is spacing squared, so small changes in S/MH produce large changes in watts. The beam angle sets which S/MH band is allowed, and the building grid decides where in that band you actually land.
Utilisation factor. UF is the share of emitted light that reaches the working plane. The chart’s 0.8 suits an open hall with light surfaces; racking, dark finishes and tall narrow rooms pull it down.
Here is how each one moves the 8–12 m row, holding everything else at the chart basis (10 m, S/MH 1.0, base result 208 W):
| Change | Calculated watts | Change vs base |
|---|---|---|
| Target 150 lx | 156 W | −25% |
| Target 300 lx | 313 W | +50% |
| S/MH 0.8 (tighter grid) | 133 W | −36% |
| S/MH 1.2 (wider grid) | 300 W | +44% |
| UF 0.7 (darker room) | 238 W | +14% |
| UF 0.55 (racked hall) | 303 W | +45% |
| MF 0.7 (dusty site) | 238 W | +14% |
| Efficacy 120 lm/W | 260 W | +25% |
| Efficacy 160 lm/W | 195 W | −6% |
Spacing and racking move the answer as much as the lux target does, so a wattage quoted from ceiling height alone is a guess.
Checking the Chart With the Lumen Method
The check runs the chart backwards from a real building: pick the beam, fit a grid to the floor plan within the allowed S/MH, and size the fixture to that grid. All three examples use 200 lx maintained, UF 0.8, MF 0.8, 150 lm/W and an open floor. This is the lumen method taught in IES design practice, explained step by step in the spacing guide.
Example 1: 20 ft ceiling (6.1 m mounting)
Building: 42 × 30 m (138 × 98 ft), 1,260 m². Required lumens for the whole floor: 1,260 × 200 ÷ 0.64 = 393,750 lm.
Option A, 90° optic (S/MH 1.0–1.2, maximum spacing 7.3 m):
- Grid 6 × 5 at 7.0 × 6.0 m (23.0 × 19.7 ft), S/MH 1.15 / 0.98
- Area per fixture 42 m² → 13,125 lm → 87.5 W → 100 W step (15,000 lm)
- Maintained result: 15,000 × 0.64 ÷ 42 = 229 lx (21.2 fc), 30 fixtures, 3,000 W
Option B, 120° optic (S/MH 1.2–1.5, maximum spacing 9.15 m):
- Grid 5 × 4 at 8.4 × 7.5 m (27.6 × 24.6 ft), S/MH 1.38 / 1.23
- Area per fixture 63 m² → 19,688 lm → 131 W → 150 W step (22,500 lm)
- Maintained result: 22,500 × 0.64 ÷ 63 = 229 lx, 20 fixtures, 3,000 W
20 ft sits on the boundary between the first two chart rows (100–150 W and 120–200 W), and both options land inside that span. They also land on the same connected load. Fewer, larger fixtures save mounting points; more, smaller fixtures give better uniformity and softer glare at a height where people can see the source. For this height class the 100W UFO high bay page lists the housings available.
Example 2: 30 ft ceiling (9.1 m mounting)
Building: 72 × 45 m (236 × 148 ft), 3,240 m². Required lumens: 1,012,500 lm.
90° optic, maximum spacing 10.9 m:
- Grid 7 × 5 at 10.3 × 9.0 m (33.7 × 29.5 ft), S/MH 1.13 / 0.99
- Area per fixture 92.6 m² → 28,929 lm → 193 W → 200 W step (30,000 lm)
- Maintained result: 207 lx (19.3 fc), 35 fixtures, 7,000 W
A tighter 8 × 5 grid at 9 × 9 m would calculate to 169 W per point. The next step down, 150 W, would deliver only 178 lx there, so 200 W is still needed and the result rises to 237 lx for 8,000 W. The chart said 200–300 W for 8–12 m; at 30 ft, near the bottom of that band, the check confirms the bottom of the range. That matches the 200W UFO high bay positioning for 8–12 m warehouses.
Example 3: 40 ft ceiling (12.2 m mounting)
Building: 96 × 60 m (315 × 197 ft), 5,760 m². Required lumens: 1,800,000 lm.
60° optic (S/MH 0.8–1.0), maximum spacing 12.2 m:
- Grid 8 × 5 at 12 × 12 m (39.4 × 39.4 ft), S/MH 0.98
- Area per fixture 144 m² → 45,000 lm → exactly 300 W → 300 W step
- Maintained result: 200 lx exactly, 40 fixtures, 12,000 W
Zero margin is a warning. If the fixture measures 140 lm/W instead of 150, the result drops to about 187 lx. Two ways out:
- Tighter grid: 9 × 6 at 10.7 × 10 m → 222 W calculated → 250 W step → 225 lx, 54 fixtures, 13,500 W
- Higher output per point: keep the 12 m grid and step up to 400 W, which also covers a 300 lx target (300 lx needs 450 W calculated, so 500 W)
40 ft is the boundary between the 200–300 W and 300–500 W rows, and the check lands exactly on it. From about 12 m upward the 400 W class starts to earn its place, especially where targets rise or the structural grid forces wider bays.
Beam Angle by Height
Beam angle is conventionally measured between the directions where intensity falls to 50% of the peak. The geometric footprint of that cone on the floor is 2 × height × tan(beam ÷ 2), which is always wider than the spacing, because adjacent beams have to overlap for uniformity.
| Mounting height | Beam | S/MH band | Spacing at band mid-height | 50% footprint diameter |
|---|---|---|---|---|
| 4–6 m (13–20 ft) | 120° (90° where glare matters) | 1.2–1.5 | 6.0–7.5 m at 5 m (20–25 ft) | 17.3 m at 5 m |
| 6–8 m (20–26 ft) | 90° | 1.0–1.2 | 7.0–8.4 m at 7 m (23–28 ft) | 14.0 m at 7 m |
| 8–12 m (26–39 ft) | 60°–90° | 0.8–1.2 | 8.0–12.0 m at 10 m (26–39 ft) | 11.5–20.0 m at 10 m |
| 12–16 m (39–52 ft) | 60° | 0.8–1.0 | 11.2–14.0 m at 14 m (37–46 ft) | 16.2 m at 14 m |
| 16 m + (52 ft +) | Narrow / high-mast | 0.8 and below | per study | per study |
A wide beam at height spreads light thinly and over rack tops; a narrow beam at low height leaves dark bands unless the grid tightens. If the quoted optic does not match the band, fix the optic before touching the wattage.
When the Chart Is Wrong
Each of these breaks a specific assumption, so each has a specific correction.
Racking aisles. Racks intercept light and turn the floor into corridors. UF falls to around 0.5–0.6, which pushes watts up by a third or more on the same grid, and the real requirement becomes vertical illuminance on the rack face. The fix is layout rather than wattage: one fixture row centred over each aisle with narrow or aisle optics. UFO vs linear high bay covers when a line source beats a round one over racking.
Dark surfaces. Black decks, dark racking and sooty walls absorb the stray light that a light room returns to the floor. UF can fall to 0.7 or below, adding about 14% to the chart value at 0.7. Enter real reflectances in the photometric software rather than assuming.
Cold storage. The lumen method does not change, but the fixture’s rating does. Our standard high bay operating range is -20°C to 45°C. Below -20°C, tell us the room temperature, the defrost regime and where the fixtures mount, and we will confirm the application. The cold storage lighting guide covers condensation and driver behaviour. The 45°C upper limit matters too: roof-level air in a hot building runs well above floor temperature, and that is the air the fixture sits in.
Dusty halls. Dirt on lenses accelerates depreciation. Lower the maintenance factor from 0.8 to 0.7, which adds about 14% to the wattage, or commit to a shorter cleaning interval. Sealed IP65 housings keep dust out of the optic cavity, but the outer lens still soils.
Low mounting with people looking up. Below about 6 m (20 ft) the fixture sits in the occupant’s field of view, and glare rather than lux becomes the constraint. Lower wattage on a tighter grid, or a linear fixture, is usually the better answer than the chart’s upper end.
Buy Lumens, Not Watts
Watts measure what a fixture consumes. The floor only receives lumens, and the conversion between them is luminous efficacy, which varies between products, builds and even variants of the same housing. Across our SJGK high bay catalogue the range is 120–160 lm/W. The same 31,250 lm the 10 m row needs is 260 W at 120 lm/W and 195 W at 160 lm/W.
So specify these, in writing:
- Measured fixture lumens, from a photometric test of the complete luminaire, not LED chip lumens multiplied out. The US Department of Energy’s solid-state lighting programme has long used whole-luminaire test data as the basis for comparing LED products.
- Efficacy in lm/W from the same test, at the colour temperature and optic you are ordering.
- The IES file for that optic, so the layout can be calculated rather than estimated.
Then treat wattage as an output of the design. A tighter grid of smaller fixtures is not a compromise: Example 1 showed 100 W and 150 W schemes at identical lux and load, and the choice between them is about mounting points, uniformity and glare. Our LED high bay lights run from 100 W to 1,200 W across UFO, reflector and high-power bodies, so either answer stays within one fixture family. The same logic applies across a whole site in our warehouse lighting work.
The Bottom Line
Use the chart to shortlist a wattage class and beam for each mounting height, then check it: fit a grid to your floor plan within the allowed S/MH, size lumens to that grid with your own lux target, UF and MF, and round to a real catalogue step with some margin. If the check and the chart disagree, believe the check, and confirm it with the fixture’s IES file before ordering.
Send us the floor plan, mounting height, racking layout and target lux, and our engineers will return a free DIALux layout with fixture count, spacing, uniformity and the IES files behind it.
FAQ
What wattage high bay do I need for a 20 ft ceiling? At 20 ft (6.1 m) mounting and 200 lx maintained, 100–150 W with a wide 90°–120° optic. In a worked 42 × 30 m example, 30 fixtures at 100 W on a 7 × 6 m grid and 20 fixtures at 150 W on an 8.4 × 7.5 m grid both deliver about 229 lx for the same 3,000 W. Subtract any hook or chain drop from the ceiling height first.
What wattage high bay do I need for a 30 ft ceiling? Around 200 W with a 90° optic at 30 ft (9.1 m) and 200 lx. A worked 72 × 45 m hall reaches 207 lx with 35 × 200 W fixtures on a 10.3 × 9 m grid. The chart range for 26–39 ft is 200–300 W; the upper end applies near 39 ft, at higher targets, or where the structural grid forces wider spacing.
What wattage do I need for a 40 ft ceiling? About 300 W with 60° optics on a 12 m (39 ft) grid for 200 lx, but that calculation has no margin at 150 lm/W. Either tighten to roughly 10.7 × 10 m with 250 W fixtures (225 lx) or step up to 400 W. For 300 lx at 40 ft, plan on 500 W at the same spacing.
Is a high bay mounting height chart accurate? It is accurate for its stated assumptions and approximate for everything else. This chart assumes 200 lx maintained, UF 0.8, MF 0.8, 150 lm/W and mid-band spacing on an open floor. Racking, dark surfaces, dust or a different lux target can move the answer by 15–50%, which is why a lumen-method check and a photometric layout should follow.
How do I adjust the chart for a different lux level? Multiply the wattage by the ratio of your target to 200 lx: 0.75 for 150 lx, 1.5 for 300 lx, 2.5 for 500 lx. Then round to a real catalogue step. At higher targets it is often better to tighten the grid than to jump two wattage steps, because uniformity and glare improve as well.
Should I choose one 400 W fixture or two 200 W fixtures? Both can deliver the same lux if the lumens match. Fewer, larger fixtures cut mounting points and installation work at height; more, smaller fixtures give finer uniformity and less glare at lower heights. A DIALux comparison with both IES files for your geometry settles it, and we prepare both options on request.